
Project management dashboards: a complete guide

Project management dashboards are the fastest way to see how your work is really going. These project dashboards pull all your project data into one clear view, so project managers and team members can track progress, check project status, and make informed decisions every day. Good project management turns on key metrics: task progress, budget tracking, resource allocation, and key performance indicators (KPIs) like the cost performance index and schedule performance index. With clear data visualization, even complex projects across multiple projects become easy to read. This guide explains what project management dashboards are, the key metrics to show, how to design them, and how to keep them useful — and at Doodex, we build them for teams every day.
session
Book a free project dashboard session
See which metrics and KPIs your team should track — and how a live dashboard would look — in a free session with a Doodex specialist.
Book a free sessioncontents
- 01What project management dashboards are
- 02The key metrics and KPIs to show
- 03Data visualization made simple
- 04Budget tracking and actual cost
- 05Tracking multiple projects and portfolios
- 06The demand management dashboard
- 07Management dashboards for leadership
- 08Key features of a good dashboard
- 09Dashboard layout and design
- 10Building a custom dashboard
- 11Continuous improvement
- →Conclusion
What project management dashboards are
Project management dashboards are visual tools that bring key project information — like task progress, deadlines, resource allocation, and other essential numbers — into one clear view, similar to how live dashboards work inside MRP software dashboards. For project managers, team members, and stakeholders watching work of any size, they make it easy to follow execution, catch obstacles early, share project status clearly, and decide faster with better facts.
In short, a dashboard turns scattered project data into a story anyone can read at a glance. Instead of digging through files, you open one screen and see project progress in real time. It connects your project planning to daily execution, so the plan and the reality always sit side by side. This guide walks through the main types of project dashboards, the benefits, how to build effective ones, and how they connect with other tools — from Google Sheets and Microsoft Project to Agile boards.
The key metrics and KPIs to show
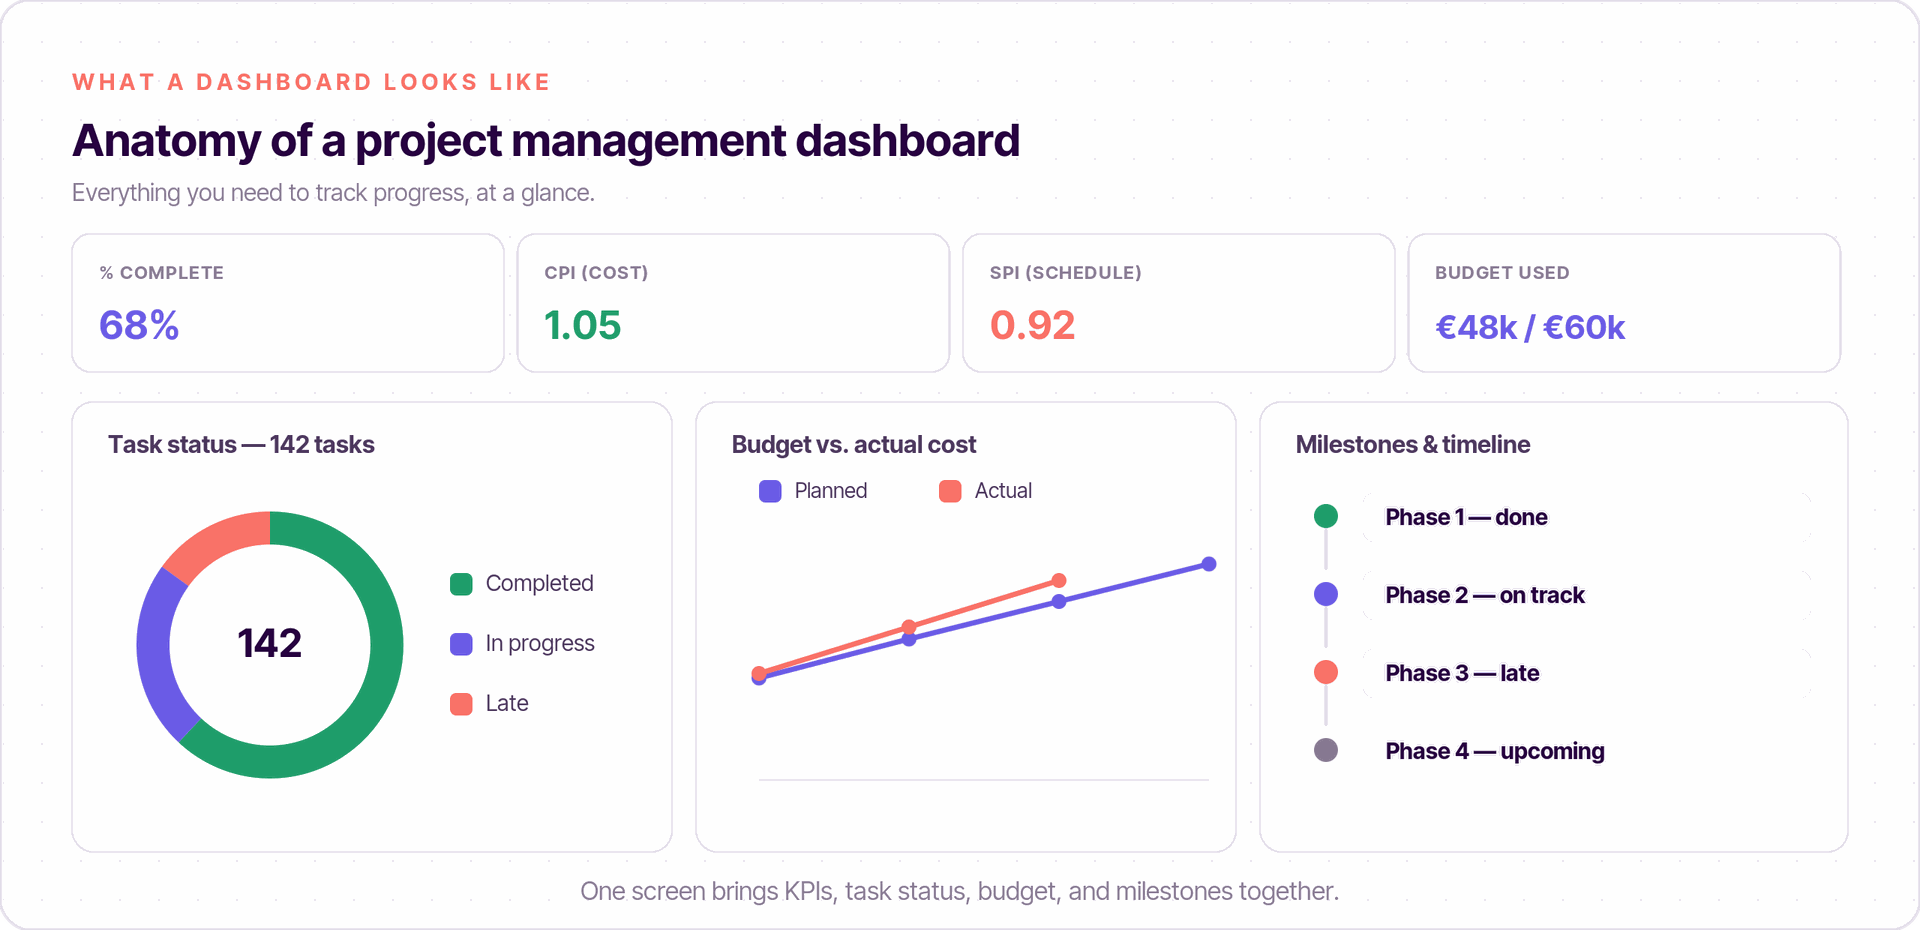
A dashboard is only useful if it shows the right numbers. Pick a short set of key project metrics tied to your goals, not every figure you can find. The most common performance metrics fall into a few groups: progress (task completion and status), schedule (upcoming deadlines and milestones), cost (budget tracking and actual cost), and people (resource utilization). Together, these dashboard metrics tell you the real project health.
Two KPIs worth knowing: CPI and SPI
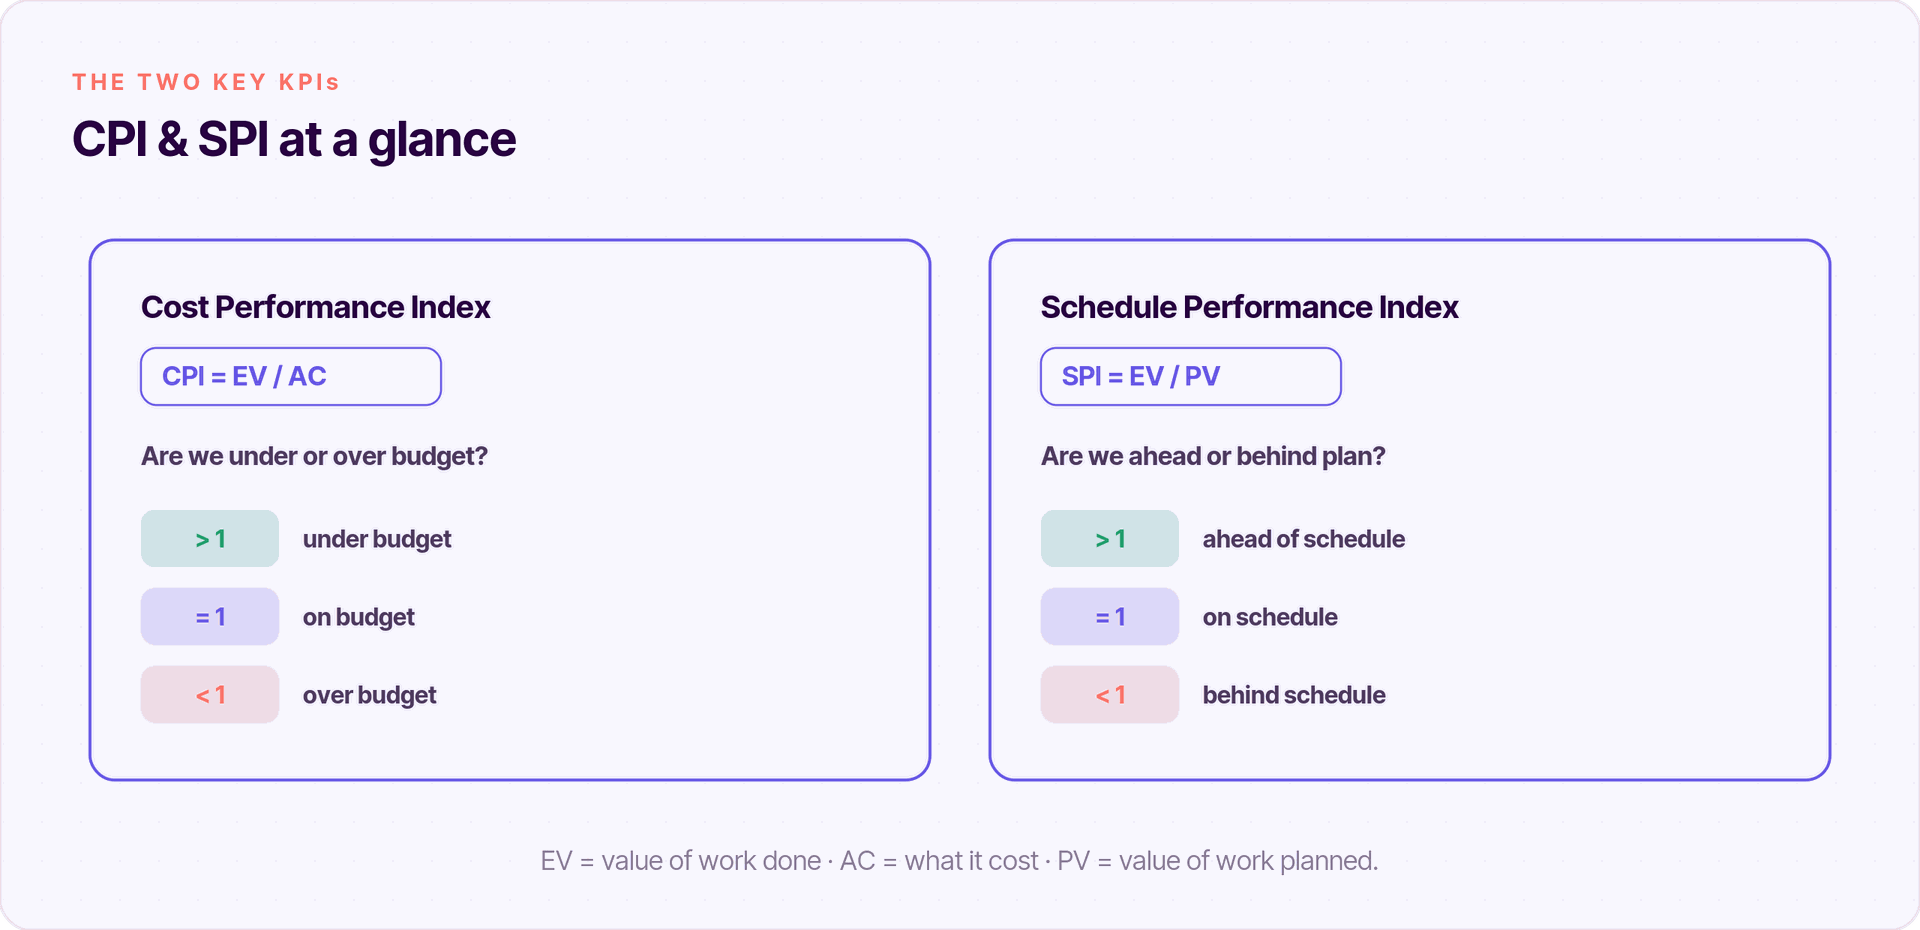
Two key performance indicators from earned value management give a fast read on a project. They rely on three values: Planned Value (PV, the budgeted cost of the work you planned), Earned Value (EV, the budgeted cost of the work actually done), and Actual Cost (AC, what that work really cost).
So a CPI of 1.05 means you are getting €1.05 of value for every €1 spent, and an SPI of 0.92 means you are slightly behind plan. These are the kind of KPIs that let project managers see trouble before it grows. Make these critical metrics easy to scan, and refine them over time so they always match your strategic and business objectives.
Data visualization made simple
Numbers in a table are hard to read. Data visualization fixes that by turning complex data into charts and graphs your teams can grasp in seconds. A bar chart shows completed tasks against the plan; a line chart helps you identify trends in project performance; a color-coded list shows task status at a glance. This is what makes a dashboard a true visual tool rather than another spreadsheet.
Keep it simple. Use color to mean something — green for on track, red for late — and add conditional formatting so problems stand out. Good visuals let stakeholders read all the data they need without anyone explaining it, which is the whole point of a dashboard.
Budget tracking and actual cost
Budget tracking is one of the most important jobs of a dashboard. Show the planned budget next to the actual cost, and the gap is obvious right away. When managers can compare what was planned with what was spent, they can act early — reallocate funds, adjust scope, or flag a risk — instead of discovering an overrun at the end.
Pair budget tracking with the cost performance index from earlier, and you get both the big picture (are we on budget?) and the detail (where is the money going?). For most teams, this single view prevents the most expensive surprises and protects project success.
Tracking multiple projects and portfolios
Many teams run more than one project at a time. A dashboard that handles multiple projects lets you compare different projects side by side and see which need attention. Roll several together and you get portfolio management: a high-level view across multiple portfolios that helps leaders oversee strategic alignment and move resources to where they matter most.
This matters because complex projects rarely live alone. Comparing a single-project view with the portfolio view shows both the detail and the whole. Standard examples include a portfolio status board, a resource heat map, and a milestone timeline that maps the project phases across programs.
Free session
Want a dashboard built on your real data?
Book a free working session with a Doodex specialist and map your KPIs, budgets, and milestones into one live Odoo Project dashboard.
Book a meetingThe demand management dashboard
A demand management dashboard answers a different question: can we take on more work? It tracks incoming project requests and the resources each would need, then compares that demand with your resource capacity. The result helps project managers and leaders decide what to approve, delay, or decline — before commitments are made and teams are overloaded.
This view is especially useful for service teams and agencies, where new requests arrive constantly and good resource allocation is the difference between healthy delivery and burnout.
Management dashboards for leadership
Management dashboards are built for executive leadership, not day-to-day work. They give a bird's-eye view across the business — an at-a-glance overview of project status, cost, and risk — without the noise of every task. Because they use customizable dashboards, each leader sees the relevant metrics for their area, with no need to micromanage the team members doing the work.
The goal here is clarity at the top. A leader should open the screen and, within seconds, know which projects are healthy, which need help, and where the next decision is.
Key features of a good dashboard
The best dashboards share a few key features. Look for these when you build or choose one:
- Real-time data. The dashboard reflects current project data, not last week's, so you track progress as it happens.
- Clear KPIs. The critical data and key metrics are front and center.
- Drill-down. Click a number to see the detail behind it, from summary to task progress.
- Customizable views. Different audiences see different things, from a status dashboard to a portfolio roll-up.
- Advanced reporting. Filters, pivots, and exports for deeper analysis when you need it.
Dashboard layout and design
A great dashboard layout is built for the eye. Good design follows a simple rule: the most important thing goes top-left, where people look first. Group related widgets, leave white space, and label everything in plain words. Limit each screen to what one audience needs — a crowded screen hides the signal.
Use charts to show dashboard data visually, and keep the colors consistent so a red item always means the same thing. When the layout is clean, your project information is easy to scan, and people actually use it. A messy layout, however detailed, gets ignored.
Building a custom dashboard
Off-the-shelf views are a fine start, but most teams end up needing a custom project management dashboard shaped around their work. Building one follows a clear path that fits into your normal project management processes:
- Define goals and KPIs. Make them SMART — Specific, Measurable, Achievable, Relevant, Time-bound — and tie each to your business objectives.
- Choose your tools. Options range from Google Sheets and Microsoft Project to dedicated tools; a spreadsheet can even act as a dashboard template to start.
- Connect your project data. Pull in task, schedule, and cost data so the dashboard stays current.
- Design the layout. Place critical metrics where they are easy to scan and add charts for data visualization.
- Share and review. Give stakeholders access and review it together on a regular rhythm.
A custom dashboard can be tailored for different projects and audiences, and can show goals, tasks, and project metrics down to the level each team needs. At Doodex, we build these inside Odoo Project so the data feeds the dashboard automatically — no manual updates.
Continuous improvement
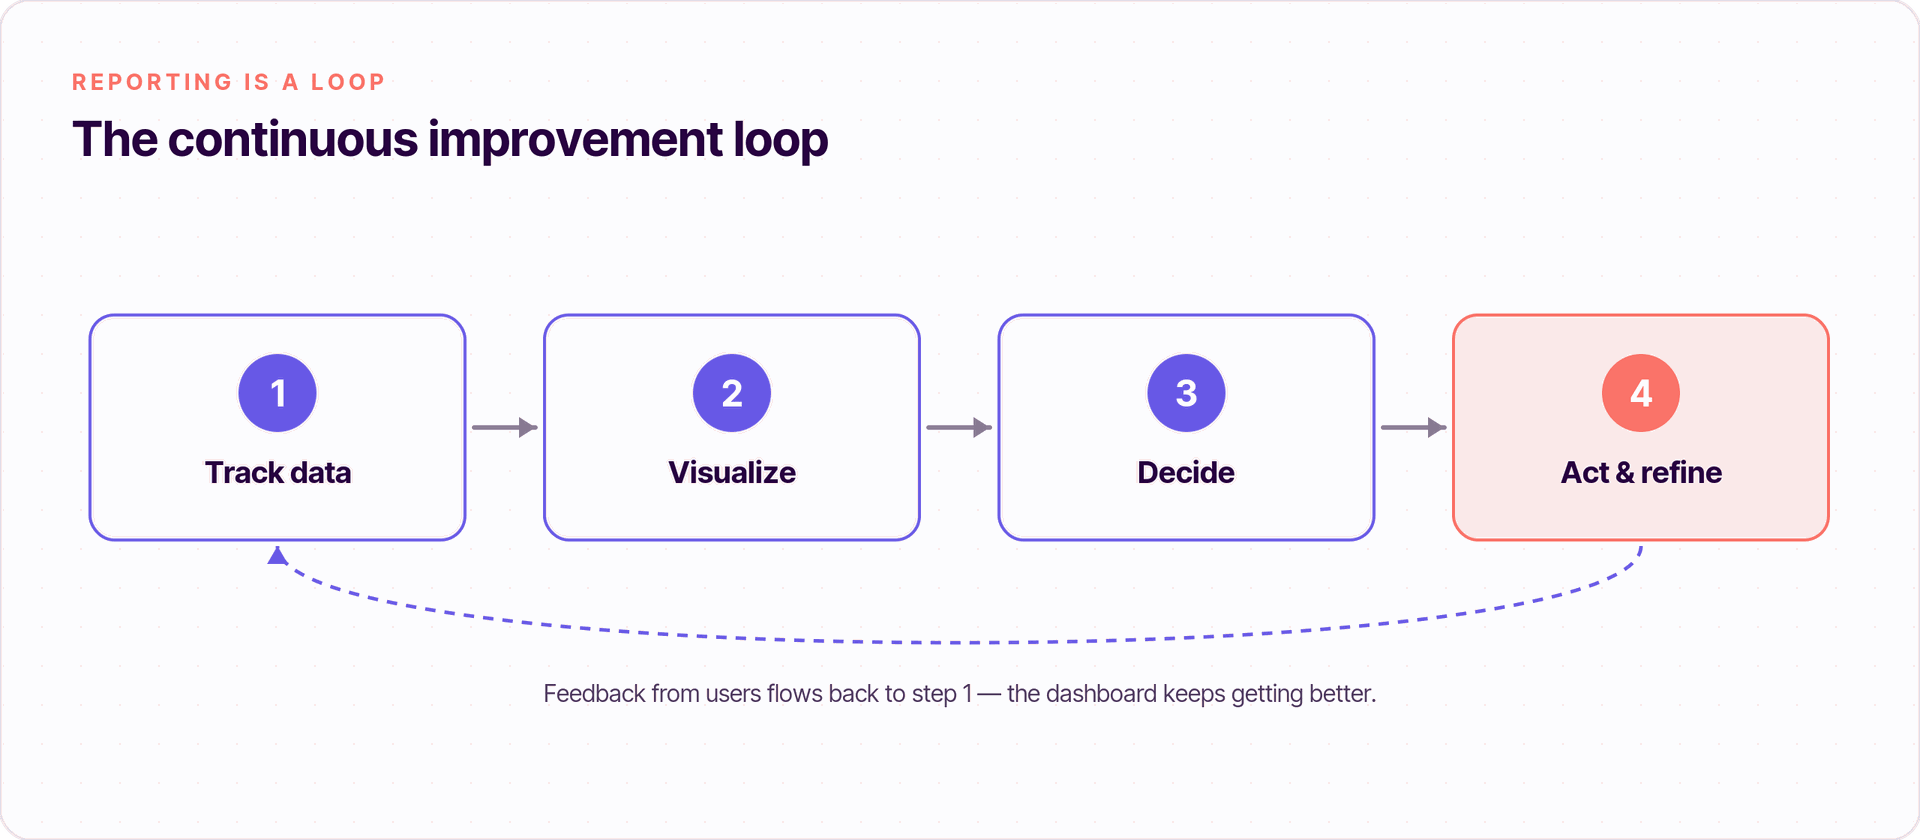
A dashboard is never “finished.” Treat it as an evolving project: review it as the work changes, and keep the project data accurate and up to date. Continuous improvement comes from regular feedback — ask the team members who use it what is missing or unclear, then refine the dashboard metrics and layout.
Over time this loop sharpens the dashboard until it shows exactly what drives decisions. That is when project tracking stops being a chore and becomes the tool that keeps every project on course.
Conclusion
Project management dashboards turn raw project data into a clear picture of project status, cost, and risk. They help you track progress, manage resource allocation, improve communication, and make informed decisions faster — whether you watch a single project or many. Combine the right key metrics, clean data visualization, solid budget tracking, and a habit of continuous improvement, and your dashboard becomes the most valuable tool you own.
At Doodex, we help teams design and build dashboards that fit their work and keep their projects on track. If you want a custom project management dashboard set up for your business, we can do it for you.
Your Odoo partner
Want a custom dashboard for your business?
Doodex designs and builds project dashboards inside Odoo Project - so your KPIs, budgets, and milestones update automatically. Talk to our team to get started.
Talk to a Doodex expertanswered
What is a project management dashboard in one sentence?
It is a visual tool that brings key project information into one screen so teams can track progress and make informed decisions.
What are the most important metrics to track?
Progress (task completion), schedule (upcoming deadlines and milestones), cost (budget tracking and actual cost), and people (resource utilization) — plus CPI and SPI for a fast health check.
What is the difference between CPI and SPI?
The cost performance index (CPI = EV/AC) tells you if you are on budget; the schedule performance index (SPI = EV/PV) tells you if you are on time.
Can I start with a spreadsheet?
Yes. Google Sheets or Excel works as a dashboard template for small projects; move to dedicated tools as your complex projects grow.