Modern companies no longer struggle with a lack of data. The real challenge is transforming all that data into clear, reliable, and actionable insights that support daily operations and long-term strategy. This is where Odoo dashboards and performance indicators play a central role.
Built on a unified Odoo ERP system, Odoo dashboards provide a comprehensive view of business performance across sales, finance, operations, human resources, and projects. By combining tables, KPIs, real-time data visualization, and interactive widgets, decision-makers can monitor performance, detect deviations early, and make smarter, data-driven decisions.
Key Takeaways
- Odoo dashboards provide a centralized, real-time view of business performance
- Performance indicators transform raw data into actionable insights
- Sales, finance, HR, and project dashboards improve operational control
- Custom dashboards support smarter decisions and sustainable growth
- Automated updates eliminate manual reporting and reduce errors
Key Takeaways
Odoo Dashboards and Performance Indicators: The Foundation
Dashboard Example: A Real-World Management View
Management Dashboard: Detailed Example
Tracking Files Integrated into Odoo Dashboards
How to Build a Dashboard with Tracking Files in Odoo
Performance Indicators: Measuring What Matters
What Is a Dashboard For?
Monitoring and Follow-Up Indicators
Commercial KPIs and Sales Dashboards
KPI Dashboards: Key Features in Odoo
Dashboard Models and Templates in Odoo
Dashboard Tools and Access Control
Performance Management and Business Intelligence
Project Management Dashboards
Activity Reporting and Monitoring
Future Trends in Odoo Dashboards
Conclusion
FAQs
Odoo Dashboards and Performance Indicators: The Foundation
Odoo dashboards and performance indicators are visual control panels that aggregate data from the Odoo database into easy-to-understand charts, tables, and metrics. Instead of navigating multiple menus or exporting spreadsheets, users access up-to-date data in one centralized interface.
A typical Odoo dashboard may include:
- Key performance indicators (KPIs) such as revenue growth, cash flow, or lead conversion rate
- Sales dashboards showing daily sales, sales trends, and commercial performance
- Tables and pivot tables for detailed performance analysis
- Real-time insights from multiple Odoo modules
Dashboards provide clarity by transforming raw data into actionable insights aligned with business goals.
Dashboard Example: A Real-World Management View
An example of an Odoo management dashboard may include the following KPI blocks:
- Monthly sales displayed in a line graph
- Prospect conversion rate shown as a percentage indicator
- Delivery lead time tracked through average fulfillment days
- Customer satisfaction score displayed in tables or gauges
Thanks to real-time data visualization, managers can monitor business performance continuously instead of waiting for monthly reports.
Custom filters allow users to:
- Compare periods (month vs month, year vs year)
- Focus on specific products, regions, or teams
- Drill down into detailed records with clickable links
Management Dashboard: Detailed Example
Consider a business dashboard example for an online sales company.
1. Sales and Income

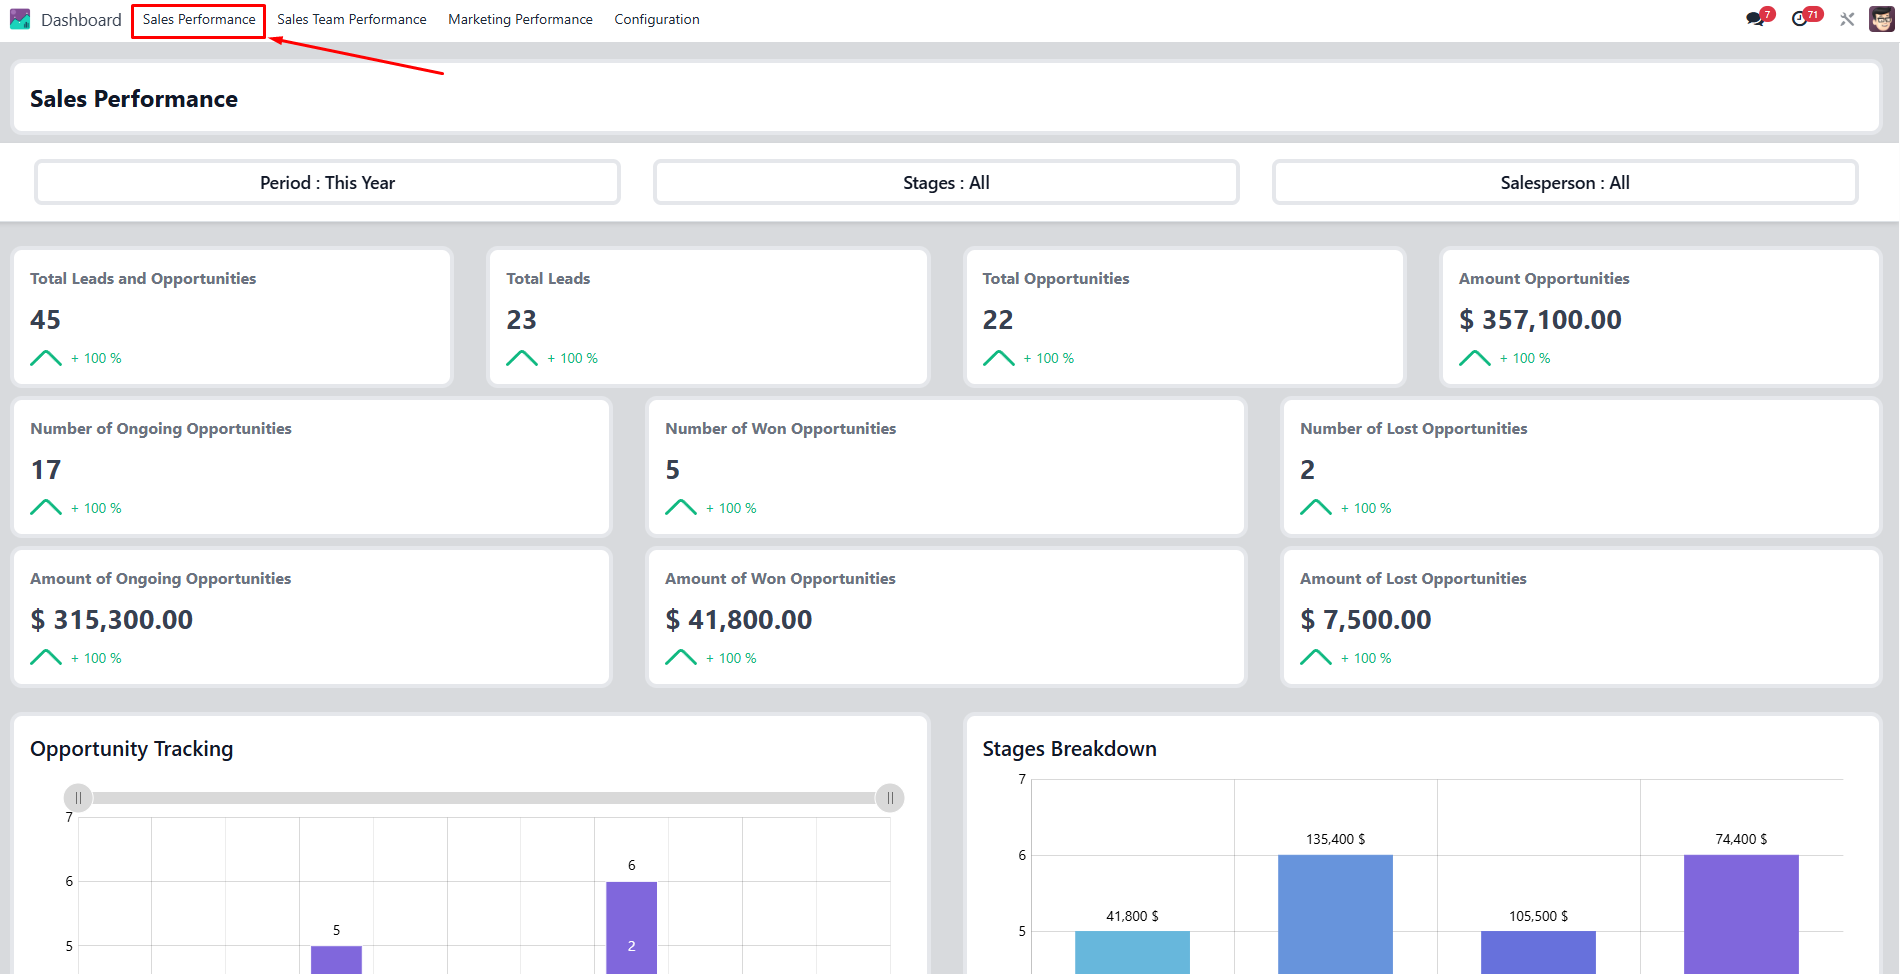
sales performance dashboard in odoo
- Monthly sales by product (bar chart or line graph)
- Daily sales tracking
- Revenue by channel (website, marketplace, B2B)
2. Marketing Performance
- Lead conversion rate
- Cost per acquisition
- Campaign ROI indicators
3. Logistics and Delivery
- Inventory levels and stock turnover
- Delivery times and return rates
- Alerts for low stock levels
4. Customer Satisfaction
- Survey results in tables
- Net Promoter Score (NPS)
- Complaint resolution time
This dashboard provides a comprehensive view of business operations while keeping information structured and accessible.
Plan Your Odoo Dashboard
Align KPIs, data, and dashboards with your business goals starting with a consultation
Tracking Files Integrated into Odoo Dashboards
A tracking file is a structured dataset used to follow activities, objectives, or operational metrics. In Odoo, tracking is no longer limited to Excel files.
1. Why Tracking Files Matter
- Ensure consistent monitoring of KPIs
- Maintain audit-ready documentation
- Improve coordination across teams
2. Tracking Files in Odoo
Tracking data can be:
- Stored directly in Odoo models
- Imported from Excel or CSV
- Linked to dashboards for live updates
Once integrated, tracking indicators appear directly in dashboards and benefit from automatic data update.
How to Build a Dashboard with Tracking Files in Odoo
To create an effective piloting dashboard:
- Define KPIs
Identify relevant metrics aligned with business goals. - Configure Widgets
Use tables, pie charts, heat maps, and line graphs. - Integrate Tracking Data
Import external data sources or link existing Odoo records. - Set Alerts and Notifications
Receive alerts when KPIs exceed thresholds or fall below targets.
This approach ensures continuous monitoring without manual reporting.
Performance Indicators: Measuring What Matters
Performance indicators are quantitative metrics used to evaluate efficiency, effectiveness, and success. In Odoo, performance indicators are fully integrated into dashboards and reports.
Examples include:
- Income growth rate
- Return on investment (ROI)
- Staff rotation rate
- Customer satisfaction level
Because all indicators are linked to live data, managers always work with real-time insights.
What Is a Dashboard For?
A performance dashboard helps organizations to:
- Monitor progress toward short- and long-term objectives
- Make informed decisions based on accurate data
- Identify trends and anticipate future risks or opportunities
- Improve efficiency through early detection of issues
Dashboards shift decision making from intuition to evidence.
Monitoring and Follow-Up Indicators
Tracking indicators are reviewed regularly to ensure alignment with strategy. Odoo simplifies this process by centralizing monitoring dashboards.
Monitoring Dashboard Configuration
- Selection of relevant metrics
- Visual presentation using charts and tables
- Automated reporting schedules
These dashboards ensure consistent oversight without increasing administrative workload.
Commercial KPIs and Sales Dashboards
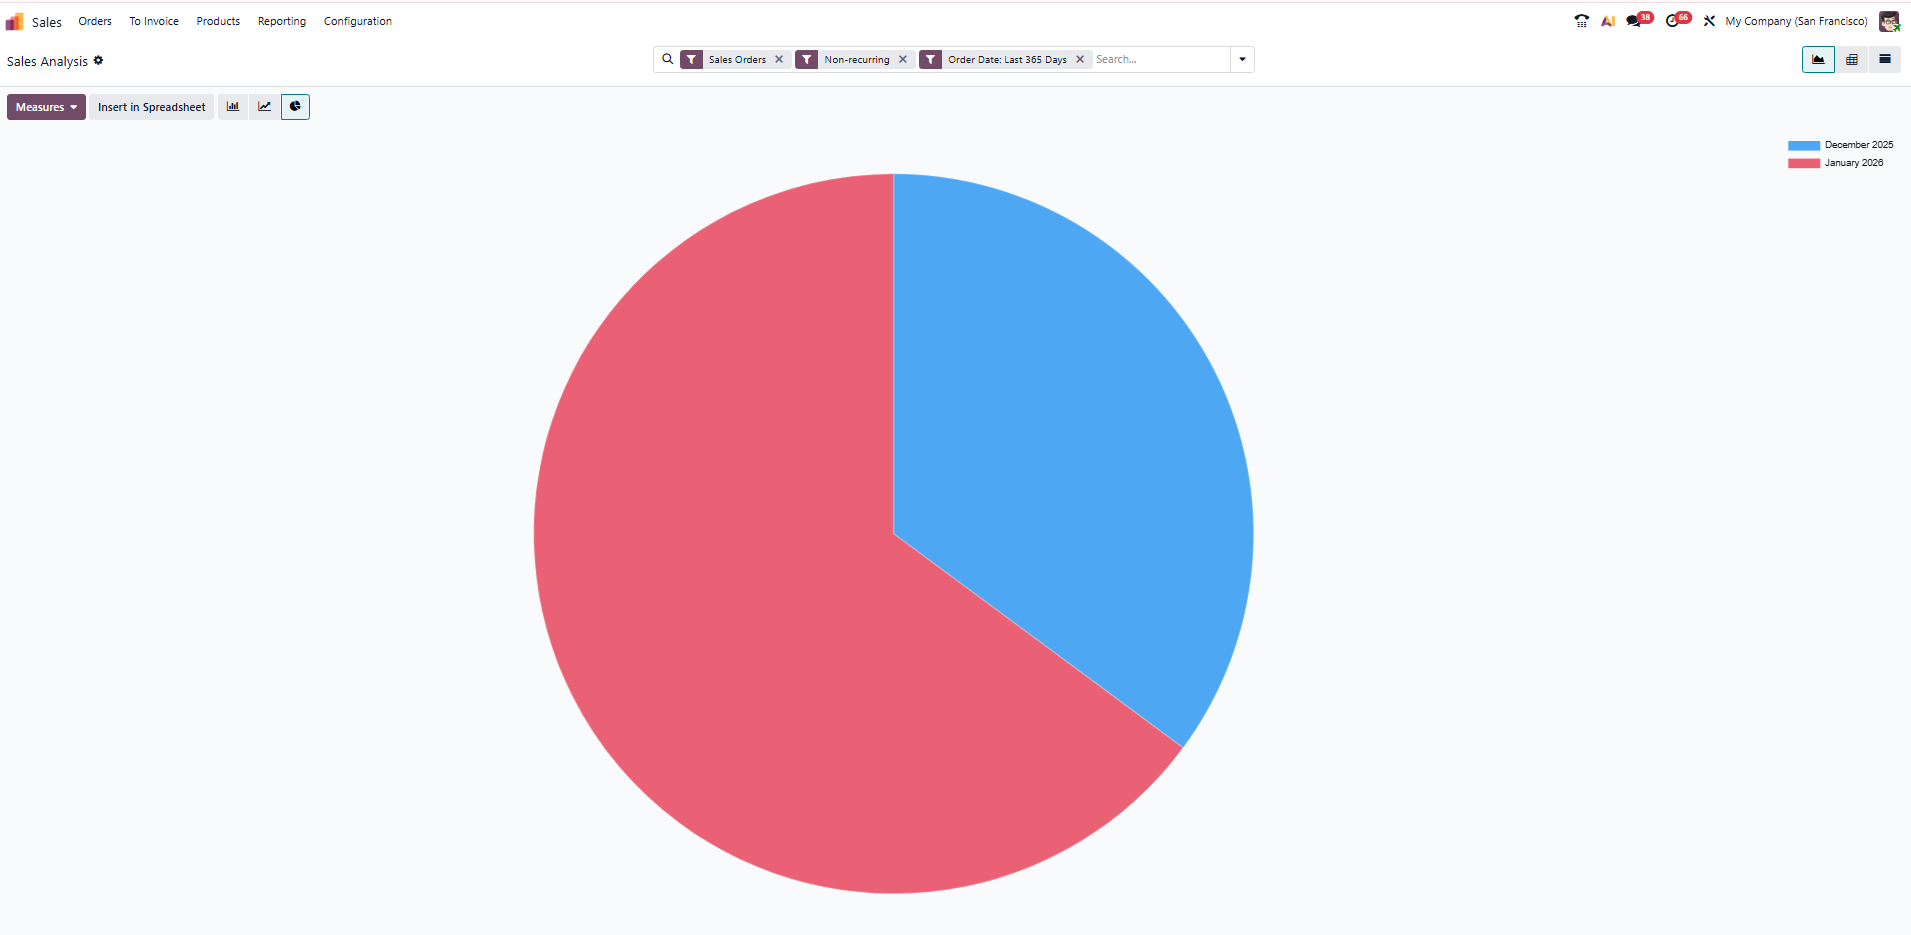
sales analysis dashboard in Odoo
Commercial KPIs are critical for sales managers and leadership teams.
1. Trade KPI Dashboard Includes:
- Turnover by product or region
- Lead conversion rate
- Customer Acquisition Cost (CAC)
- Customer Lifetime Value (CLV)
2. Business Dashboard Example
- Sales trends by region
- Campaign performance analysis
- Profitability by product line
This enables sales teams to adjust strategies quickly and improve commercial performance.
Ready to Build Your Odoo Dashboard?
Move from spreadsheets to automated KPI tracking with a structured Odoo implementation
KPI Dashboards: Key Features in Odoo
An Odoo KPI dashboard offers:
- Customized dashboards per role or department
- Interactive dashboards with drill-down capabilities
- Automatic data update from all connected modules
- Alerts and notifications for critical thresholds
Dashboards can be built using drag and drop functionality, making them accessible even to non-technical users.
Dashboard Models and Templates in Odoo
Odoo provides dashboard models for rapid deployment:
- Sales dashboard
- Financial performance dashboard
- Human resources dashboard
Example of a Personalized Dashboard Model
- Sales indicators: monthly and annual trends
- Financial indicators: cash flow, margins
- HR indicators: team performance, absenteeism
Each model can be adapted to specific operational needs.
Dashboard Tools and Access Control
Odoo dashboards include robust access control features:
- User permissions
- Record rules
- Separate dashboards per role
This ensures sensitive financial performance data remains restricted while still supporting transparency.
Performance Management and Business Intelligence
Performance management relies on continuous measurement and adjustment. Odoo dashboards act as a business intelligence layer by:
- Centralizing all the data
- Supporting in-depth analysis
- Enabling predictive analytics and future trends
This transforms dashboards from reporting tools into strategic assets.
Project Management Dashboards

Project management dashboard in Odoo
For project-based organizations, Odoo project dashboards provide:
- Deadline tracking
- Budget vs actual cost monitoring
- Resource allocation indicators
Project managers gain real-time visibility over progress and risks.
Activity Reporting and Monitoring

Smart time tracking in Odoo
Activity reporting dashboards automate:
- Data collection from multiple sources
- Performance analysis across departments
- Visual presentation with tables and charts
Monitoring dashboards ensure alignment between daily operations and strategic objectives.
Future Trends in Odoo Dashboards
Future dashboard trends include:
- More predictive analytics
- Enhanced real-time data visualization
- Deeper integration with external data sources
- Smarter dashboards driven by business intelligence
These developments further strengthen data-driven decision making.
Go Beyond Standard Dashboards
Customize Odoo dashboards with advanced KPIs, roles, and predictive insights
Conclusion
Odoo dashboards are far more than visual reports. They are strategic tools that enable companies to monitor performance, optimize operations, and align teams around shared business goals.
By combining tables, KPIs, interactive dashboards, and real-time data, Odoo transforms complex information into clear, decision-ready intelligence. Whether used for sales tracking, financial performance, project management, or activity monitoring, dashboards help organizations move faster, reduce risk, and grow sustainably.
With its flexible design, powerful tools, and integrated ERP architecture, Odoo empowers businesses to turn data into confident, strategic action.
FAQs
They are used to monitor business performance, track KPIs, and support informed decision making.
Yes, Odoo allows fully customized dashboards by role, department, or business goal.
Yes, dashboards use live data from the Odoo database with automatic updates.
Yes, Odoo supports integration of external data through imports and connectors.
Yes, access control, user permissions, and record rules ensure data security.
Sales, finance teams, human resources, operations, and management all benefit.
Dashboards complement reports by providing real-time insights and visual summaries.