
Sales dashboard example with Odoo

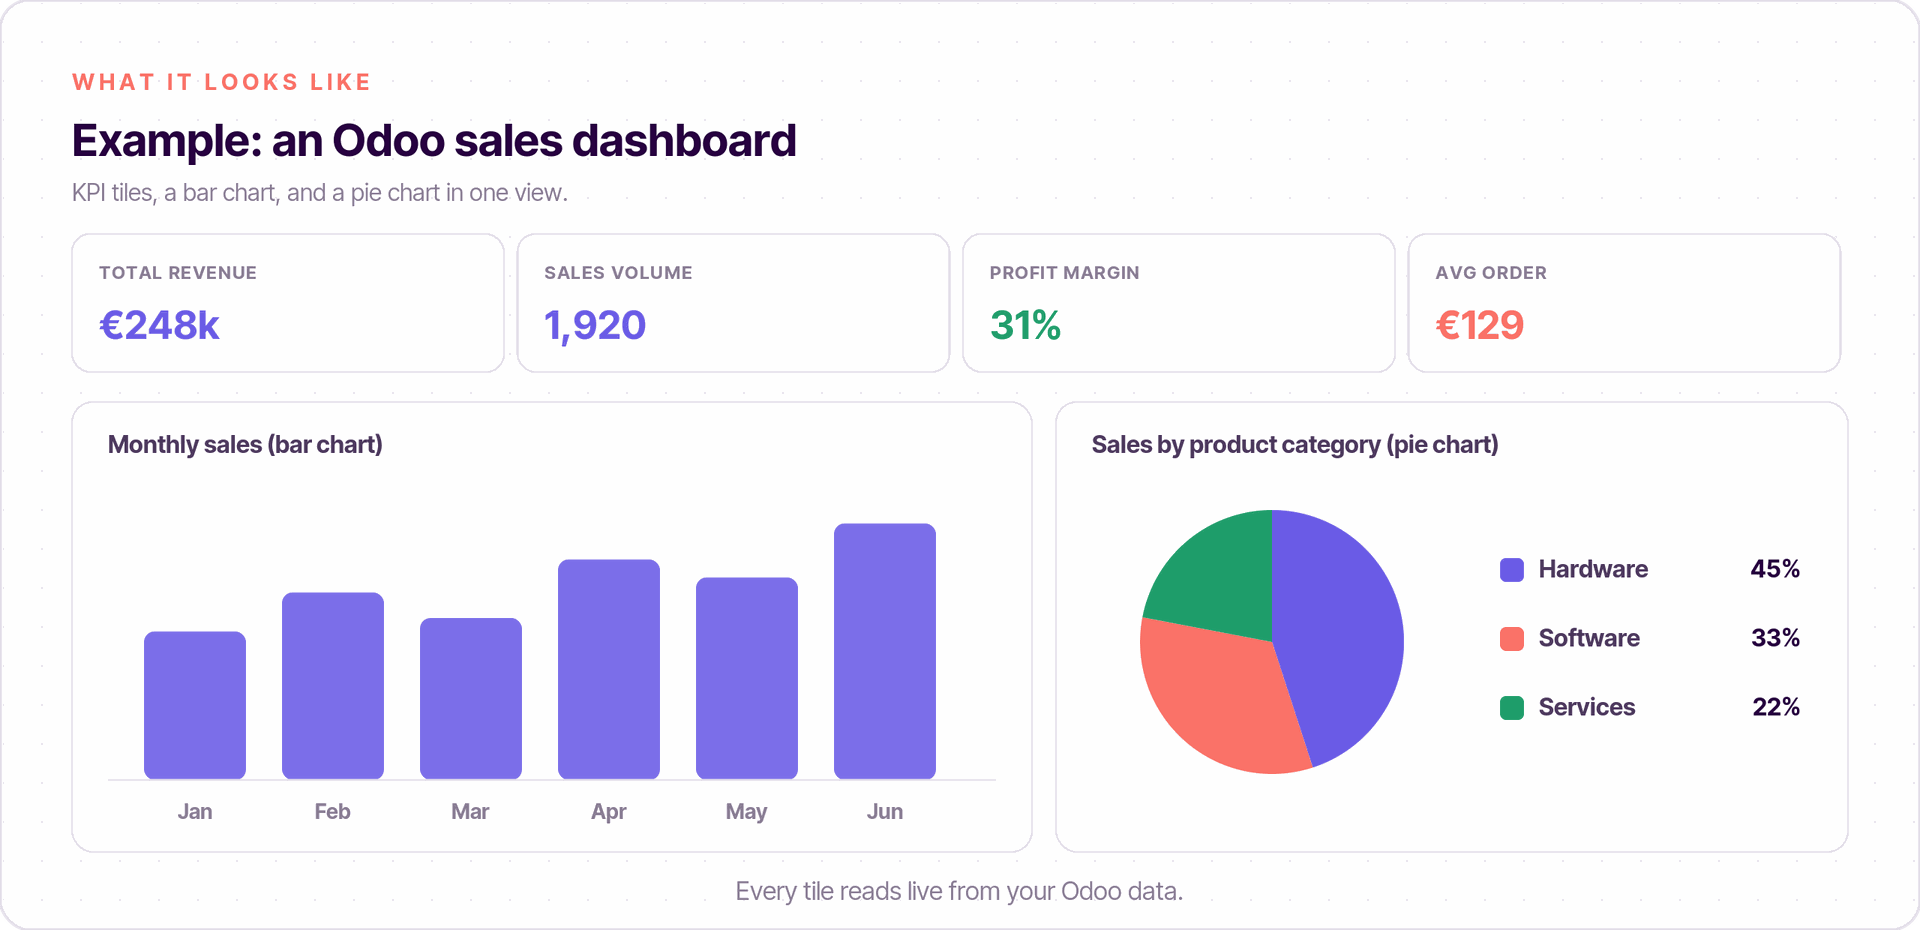
This sales dashboard example with Odoo shows how to turn raw sales data into a clear, real-time view of your business. A sales dashboard is a visual tool that tracks your key performance indicators — total revenue, sales volume, profit margin, and sales by product category — so sales managers and sales teams always know how they are doing.
With Odoo's dashboard and business intelligence tools, you can build charts, monitor business performance live, and make informed decisions from one screen. This guide covers the key business metrics to include, how data visualization works with a bar chart or pie chart, and how to build your dashboard step by step.
session
Book a free sales dashboard session
See which KPIs and charts your team should track — and how a live Odoo dashboard would look — in a free session with a Doodex specialist.
Book a free sessioncontents
- 01Why use a sales dashboard
- 02What an Odoo dashboard is
- 03Real-time data and business intelligence
- 04Key business metrics to include
- 05Turning sales data into charts
- 06Data visualization: bar chart and pie chart
- 07Building each dashboard item
- 08Connecting external data sources
- 09Key features of the Odoo dashboard
- 10Build your sales dashboard, step by step
- →Conclusion
Why use a sales dashboard
A sales dashboard gives you a single, clear view of your sales performance. Instead of digging through reports, you open one screen and see total revenue, monthly sales, and how each of your sales teams is tracking. It helps sales managers spot trends early, coach salespeople, and steer the business with facts.
The value is simple: a dashboard turns scattered numbers into valuable insights. With live figures in front of them, managers can track KPIs, catch problems fast, and support data-driven decision-making across the team.
What an Odoo dashboard is
An Odoo dashboard is a screen that pulls your Odoo data — from Sales, CRM, and other modules — into charts and KPI tiles. Because it reads straight from the Odoo database, every sales order you record updates the dashboard automatically. You can start from Odoo's standard dashboards or build a new dashboard shaped around your goals.
Real-time data and business intelligence
The biggest reason to use Odoo is real-time data. As soon as a deal closes, the dashboard updates, giving managers real-time insights with no manual work. This is business intelligence made simple: the numbers you see are always current, so decisions rest on today's reality, not last month's export.
Because the data is live, you can monitor business performance at a glance and act on actionable insights the moment they appear — the heart of data-driven decisions.
Key business metrics to include
A good dashboard tracks a focused set of key business metrics. Pick the key metrics that match your goals rather than every number you can find. These are the essentials for strong sales performance and financial performance:
Turning sales data into charts
Raw sales data is hard to read in a table, so Odoo lets you aggregate data and show it visually. You choose a measure (like revenue or count), group it by a field (like month or salesperson), and Odoo builds the chart. Click any point and you can drill into the underlying data behind it, so you always know where a number comes from.
This makes it easy to read sales trends, compare periods, and analyze which products or salespeople are ahead — turning plain figures into a clear story.
Free session
Want a dashboard built on your sales data?
Book a free working session with a Doodex Odoo specialist and turn your revenue, volume, and margin into one live dashboard.
Book a meetingData visualization: bar chart and pie chart
Data visualization is what makes a dashboard click. Odoo offers several visualization types so you can match the chart to the question. A bar chart is great for monthly sales and comparisons; a pie chart shows how a total splits, like sales by product category; a line chart is best for trends over time.
Keep each chart simple and clearly labeled. The goal is that anyone can read the display in seconds and focus on what matters, without needing an analysis expert to explain it.
Building each dashboard item
Every dashboard item is a saved view you pin to the screen. To add one, build a chart or list from a specific product, team, or period, then insert it into your new dashboard. You can customize the visual settings — colors, labels, and size — and add custom filters so viewers can filter and focus on their own slice of the data.
Use the search bar and saved filters to let each user reach their view fast. A well-built dashboard item answers one question clearly — resist the urge to cram several into one.
Connecting external data sources
Sometimes not all the numbers live in Odoo. With business intelligence tools you can pull in external data sources — for example, connecting MySQL databases or other systems — so your dashboard reflects all the data in one place. This is useful when you want to blend Odoo data with figures from another tool for a fuller picture.
Key features of the Odoo dashboard
A few key features make the Odoo dashboard practical for daily use:
- Real-time data. Every tile reflects the latest Odoo data automatically.
- Custom filters. Slice by date, team, or specific product in a click.
- Data security. User permissions and record rules control who sees what.
- Responsive design. Read your dashboard on any screen.
- Drill-down. Jump from a chart to the underlying data behind it.
Exact options depend on your Odoo version, but the core idea is the same: a flexible, secure way to track KPIs.
Build your sales dashboard, step by step
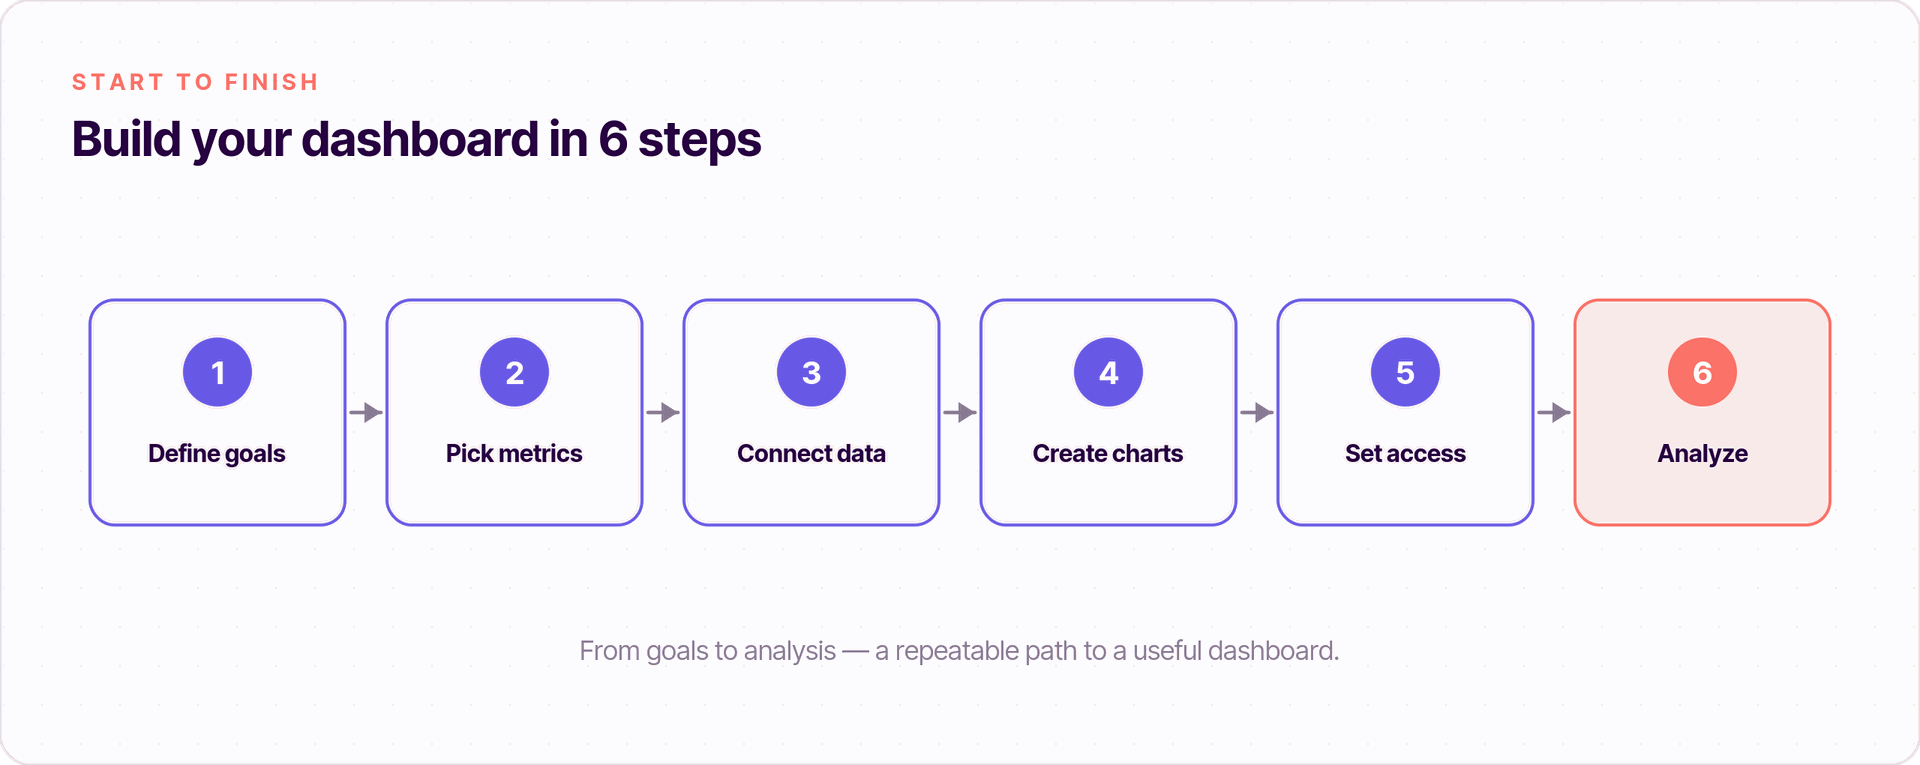
- Define goals. Decide what to monitor and the sales targets you want to hit.
- Select metrics. Choose the key business metrics that measure overall, team, and product performance.
- Configure Odoo. Use the Sales, CRM, and reporting modules to aggregate data.
- Create charts. Build a bar chart, pie chart, and lists, then create and pin each dashboard item.
- Set access. Apply user permissions for data security, so your users each access the right view.
- Analyze and adjust. Review the newly created dashboard regularly and refine it for better informed decision-making.
Conclusion
A sales dashboard is one of the most useful tools you can build in Odoo. By choosing the right key metrics, using clear data visualization like a bar chart or pie chart, and reading everything from real-time data, you give your team valuable insights that drive data-driven decisions and stronger sales performance.
Ready to build your own sales dashboard example with Odoo? As a certified Odoo partner, Doodex can design, configure, and support a dashboard tailored to your business — so you always know your numbers and hit your goals.
Your Odoo partner
Ready to build your sales dashboard?
Doodex designs, configures, and supports Odoo sales dashboards tailored to your business - so you always know your numbers. Talk to our team to get started.
Talk to a Doodex expertanswered
What is a sales dashboard?
A sales dashboard is a visual tool that tracks your key performance indicators — like total revenue and sales volume — in real time.
Which metrics should I include?
Focus on a few key business metrics: total revenue, sales volume, profit margin, sales by product category, and top customers.
Can I use data from outside Odoo?
Yes. Business intelligence tools let you connect external data sources such as MySQL databases so you see all the data together.
Is my dashboard data secure?
User permissions and record rules control access, so each user only sees the Odoo data they should — good data security by design.